Excel Charts
Advertisement
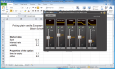
Excel Mixer Nano v.1
Excel Mixer Nano is the quickest, most efficient, safest and cheepest way to bring your Excel data and Excel charts to life with your mouse! All you have to do is select a range of cells in Excel, and Excel Mixer Nano will provide you with a slider
Advertisement
Multiple Y Axes for MAC Excel 2004 v.1.01
Multiple Y axes plots are created from existing Excel Charts.

Zplots v.1.6
Plot Impedance Data. Impedance plots using Excel Charts. Zplots uses Excel's charting abilities to plot impedance data obtained from a variety of sources, including the W5BIG AIM4170 Antenna Analyzer, the N2PK Vector Network Analyzer,
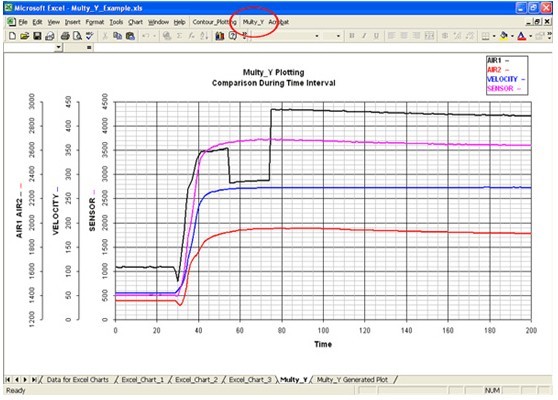
Multy_Y v.1.01
Multiple Y axes plots are created from existing Excel Charts. Each Excel chart appears as a new Y axis on the Multy_Y plot. The plot is a picture that appears on a separate Excel Chart.
Aspose.Cells for JasperReports v.1.1.2.0
Aspose.Cells for JasperReports allows exporting reports from JasperReports & JasperServer to MS Excel XLS format. It is written purely in Java and a single provided JAR file can easily be deployed on the machines running JasperReports or JasperServer
Gantt Chart Builder (Excel) v.6.2.1
The Gantt Chart Builder System provides a system to build professional quality Gantt charts without the need for Microsoft Project or similar products. Charts can be constructed with either Microsoft Excel or Access. This version is the Excel
EZplot for Excel v.1.01
EZplot is a plotting and data calculation computer software which enhances Excel. EZplot improves productivity by easily creating many plots in seconds. Plots are defined with parameter names instead of requiring manual selection of data.
EzPaste v.4.0
Create presentations directly from Excel by taking advantage of the amazing transfer of hundreds of charts and tables at once in any format to PowerPoint and 5 other applications, while keeping full control of the operation.

Analyse-it! Standard Edition v.3.01
Building on the industry-standard spreadsheet, Analyse-it extends Excel with statistics and charts for visualising, describing and testing hypotheses on your data.
WorkSheet Manager v.1.0
The Worksheet Manager is a powerful utility that allows you to list all open Excel workbooks, display all worksheets and chart sheets in a selected workbook and quickly select a worksheet or chart sheet of interest.