Excel Charts
WinSTAT v.9 1
WinSTAT is the statistics Add-In for Microsoft Excel. It includes a wealth of statistics functions, yet is easy to use. Everything you need can be specified via the easy-to-use menu and dialogs.
MmSensitivity v.2 7
Sensitivity Analysis add-in for Microsoft Excel 97, 98, 2000, and 2001 for Windows. The toolkit is intended for the analysts in economy, science and engineering.
XlDEA v.2.0
Data Envelopment Analysis (DEA) is a powerful method widely used in the evaluation of performance of Decision Making Units (DMUs). These can be business units (for example points of sales, bank branches, dealers, franchisees), government agencies,
Aspose.Slides for .NET v.7.2.0.0
Aspose.Slides is a .NET component to read, write and modify a PowerPoint document without using MS PowerPoint. PowerPoint versions from 97-2007 and all three PowerPoint formats: PPT, POT, PPS are also supported. Also save PowerPoint slides into PDF.

RoboShutdown
RoboShutdown is a powerful utility software that helps you automatically shutdown, power off, lock session, stand by, hibernate, run program, pop up message and perform many other tasks at any time you specify. RoboShutdown is designed to provide the best
Test Maestro II v.2.0.0006
Test Maestro II is an advanced Windows based Test Bank and Test Generator for teachers. It creates fully formatted tests from a test bank of questions you enter or import. It includes a full featured word processor for composing the questions.
Empower! for Oracle v.2.2.20
Empower! is a desktop program application designed to produce rapid business benefit by helping developers to create and deliver better performing Oracle SQL and PL/SQL code in a few minutes, leading to lower costs. As a desktop application,

Excel Copy and Paste Multiple Charts Into MS Word Software
Copy multiple charts from MS Excel into a new or existing MS Word document. Excel 2000 or higher required. Word 2000 or higher required.

Excel Extract Data From Charts or Graph Software
Extract data from one or many charts in MS Excel. Save all extraction results as a text file. Excel 2000 or higher required.
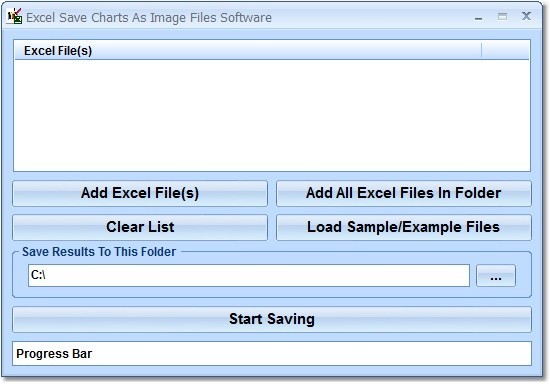
Excel Save Charts As Image Files Software v.7.0
This software offers a solution to users who want to save all charts as images in one or more Excel files.
Dashboard Tools for Excel v.2.2.0
With Dashboard Tools for Excel you can use Sparklines, Heatmaps, Mini Charts, Bump charts and other special charts, getting dramatically improved data visualization for fast and effective parallel comparisons.
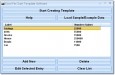
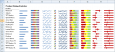
Excel Pie Chart Template Software v.7.0
This software offers a solution to users who want to create a simple pie chart. Excel fields are automatically generated and editable. By quickly generating pie charts, you will be able to visually represent data easily. Excel 2000 or higher required